

I originally drafted these notes back in August 2026 and only recently remembered that I never turned them into a proper post.
By that time, I had already been running our own IoT power-monitoring breaker on the office’s main electrical line for several months. I installed it because I wanted an independent way to monitor our electricity consumption and eventually compare its readings with Meralco’s own meter.
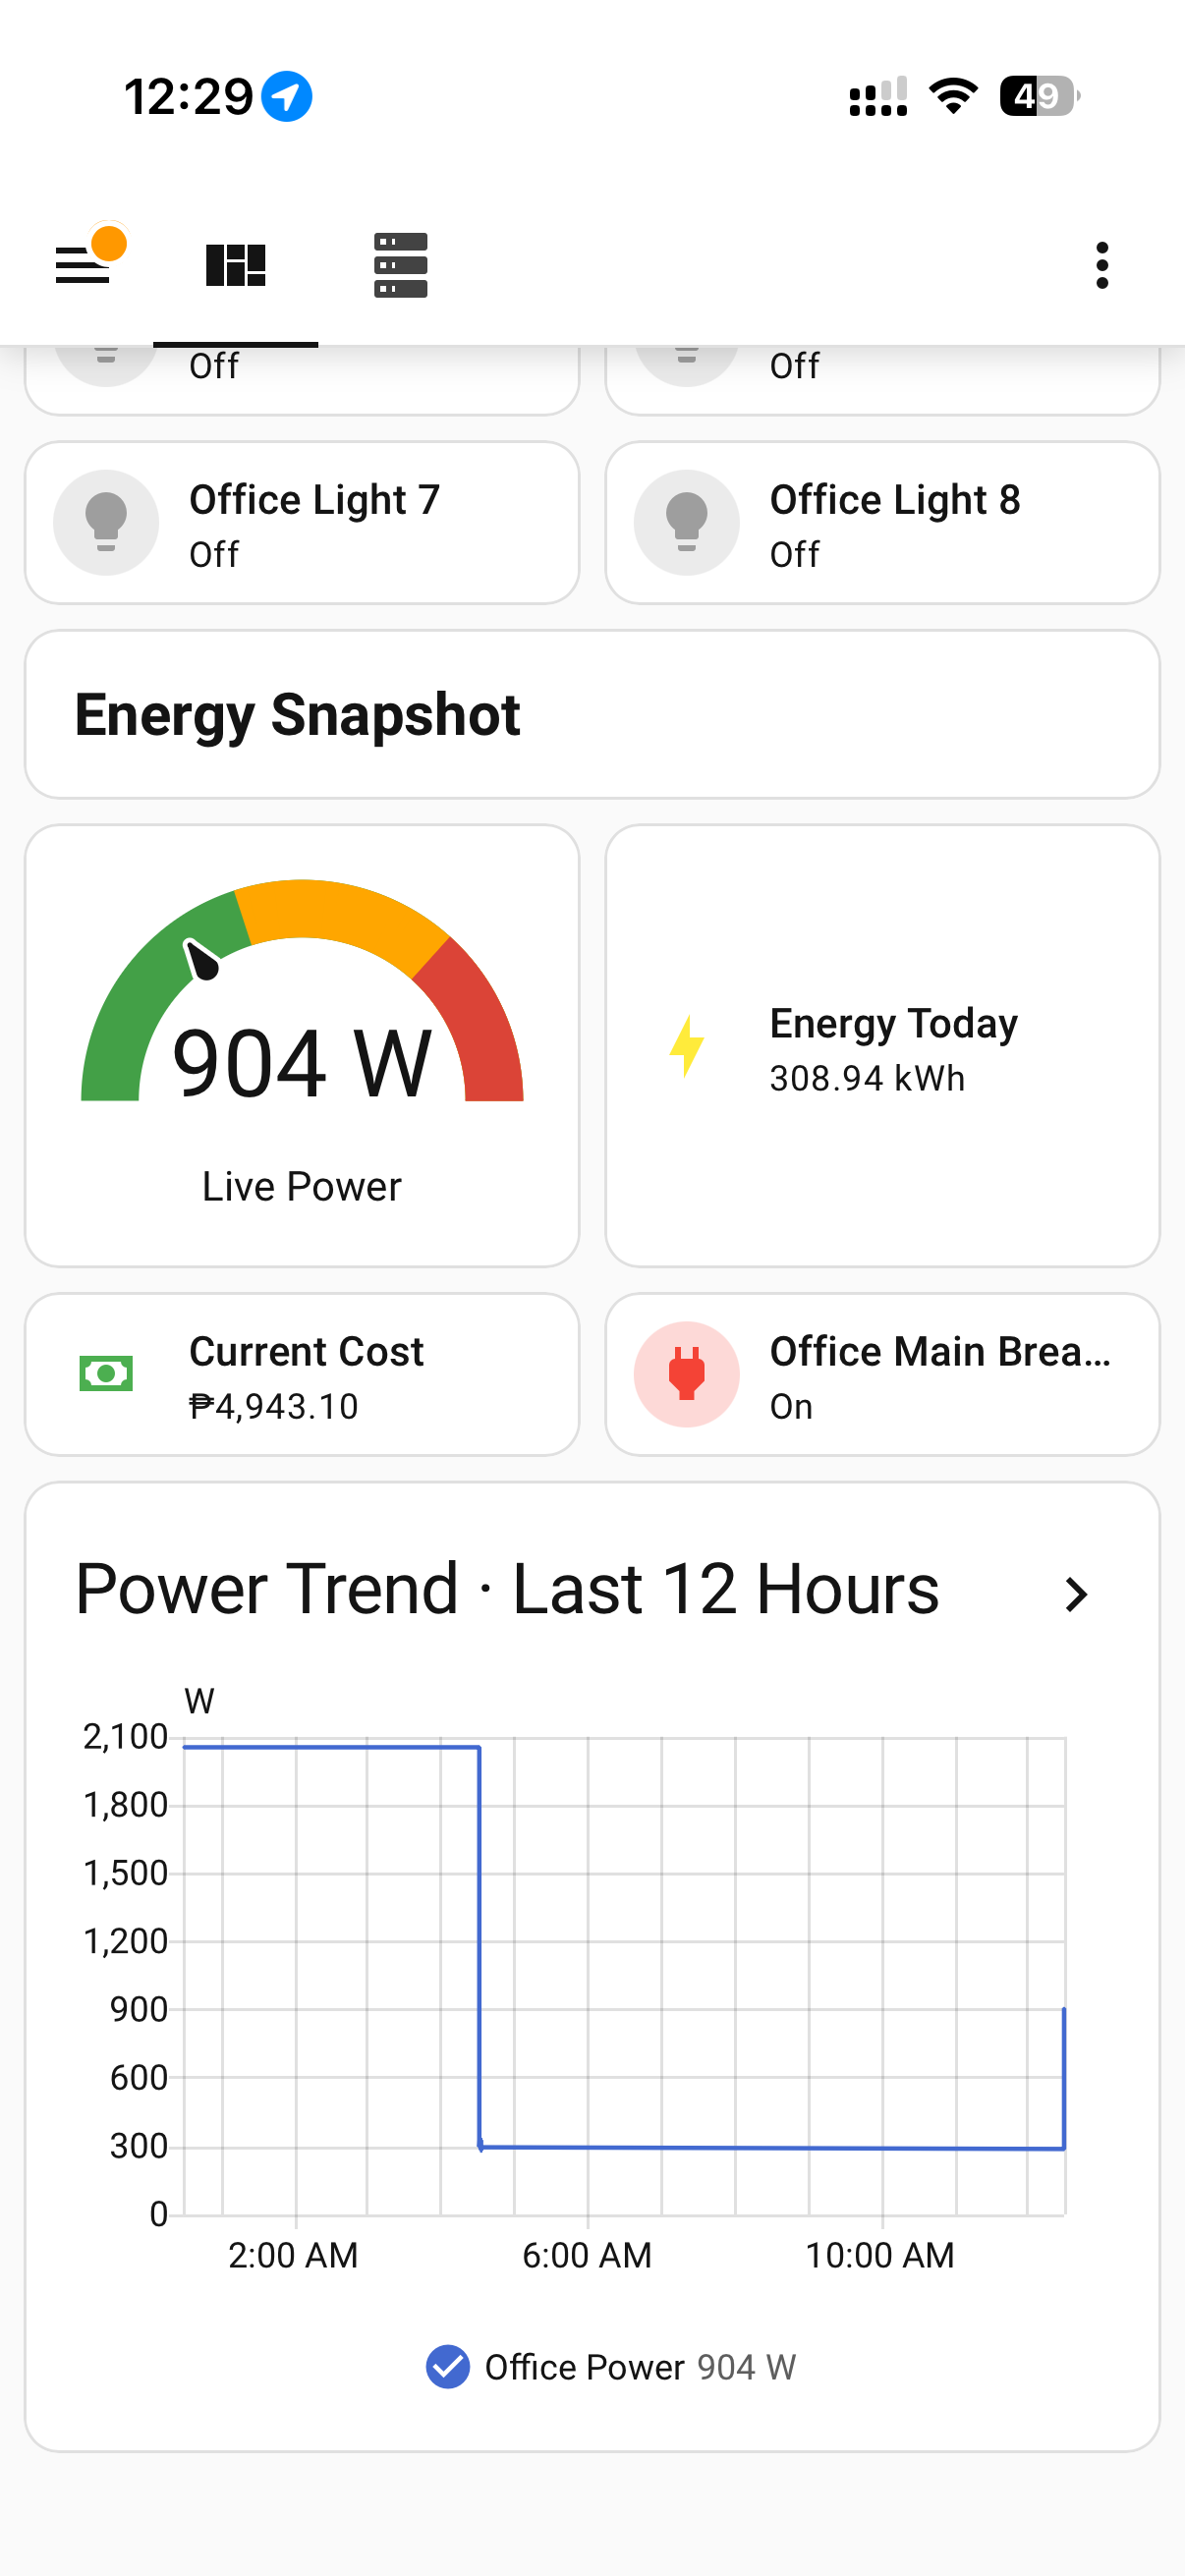
The system is connected to our Home Assistant server and continuously monitors real-time power, voltage, current, energy consumption, and estimated electricity cost. Since the setup operates independently from Meralco’s meter, it gives me a useful reference point for checking whether both systems are seeing approximately the same electrical load.
When our electricity bill arrived, I decided to make a direct comparison.
At the same moment, I checked the readings from both systems:
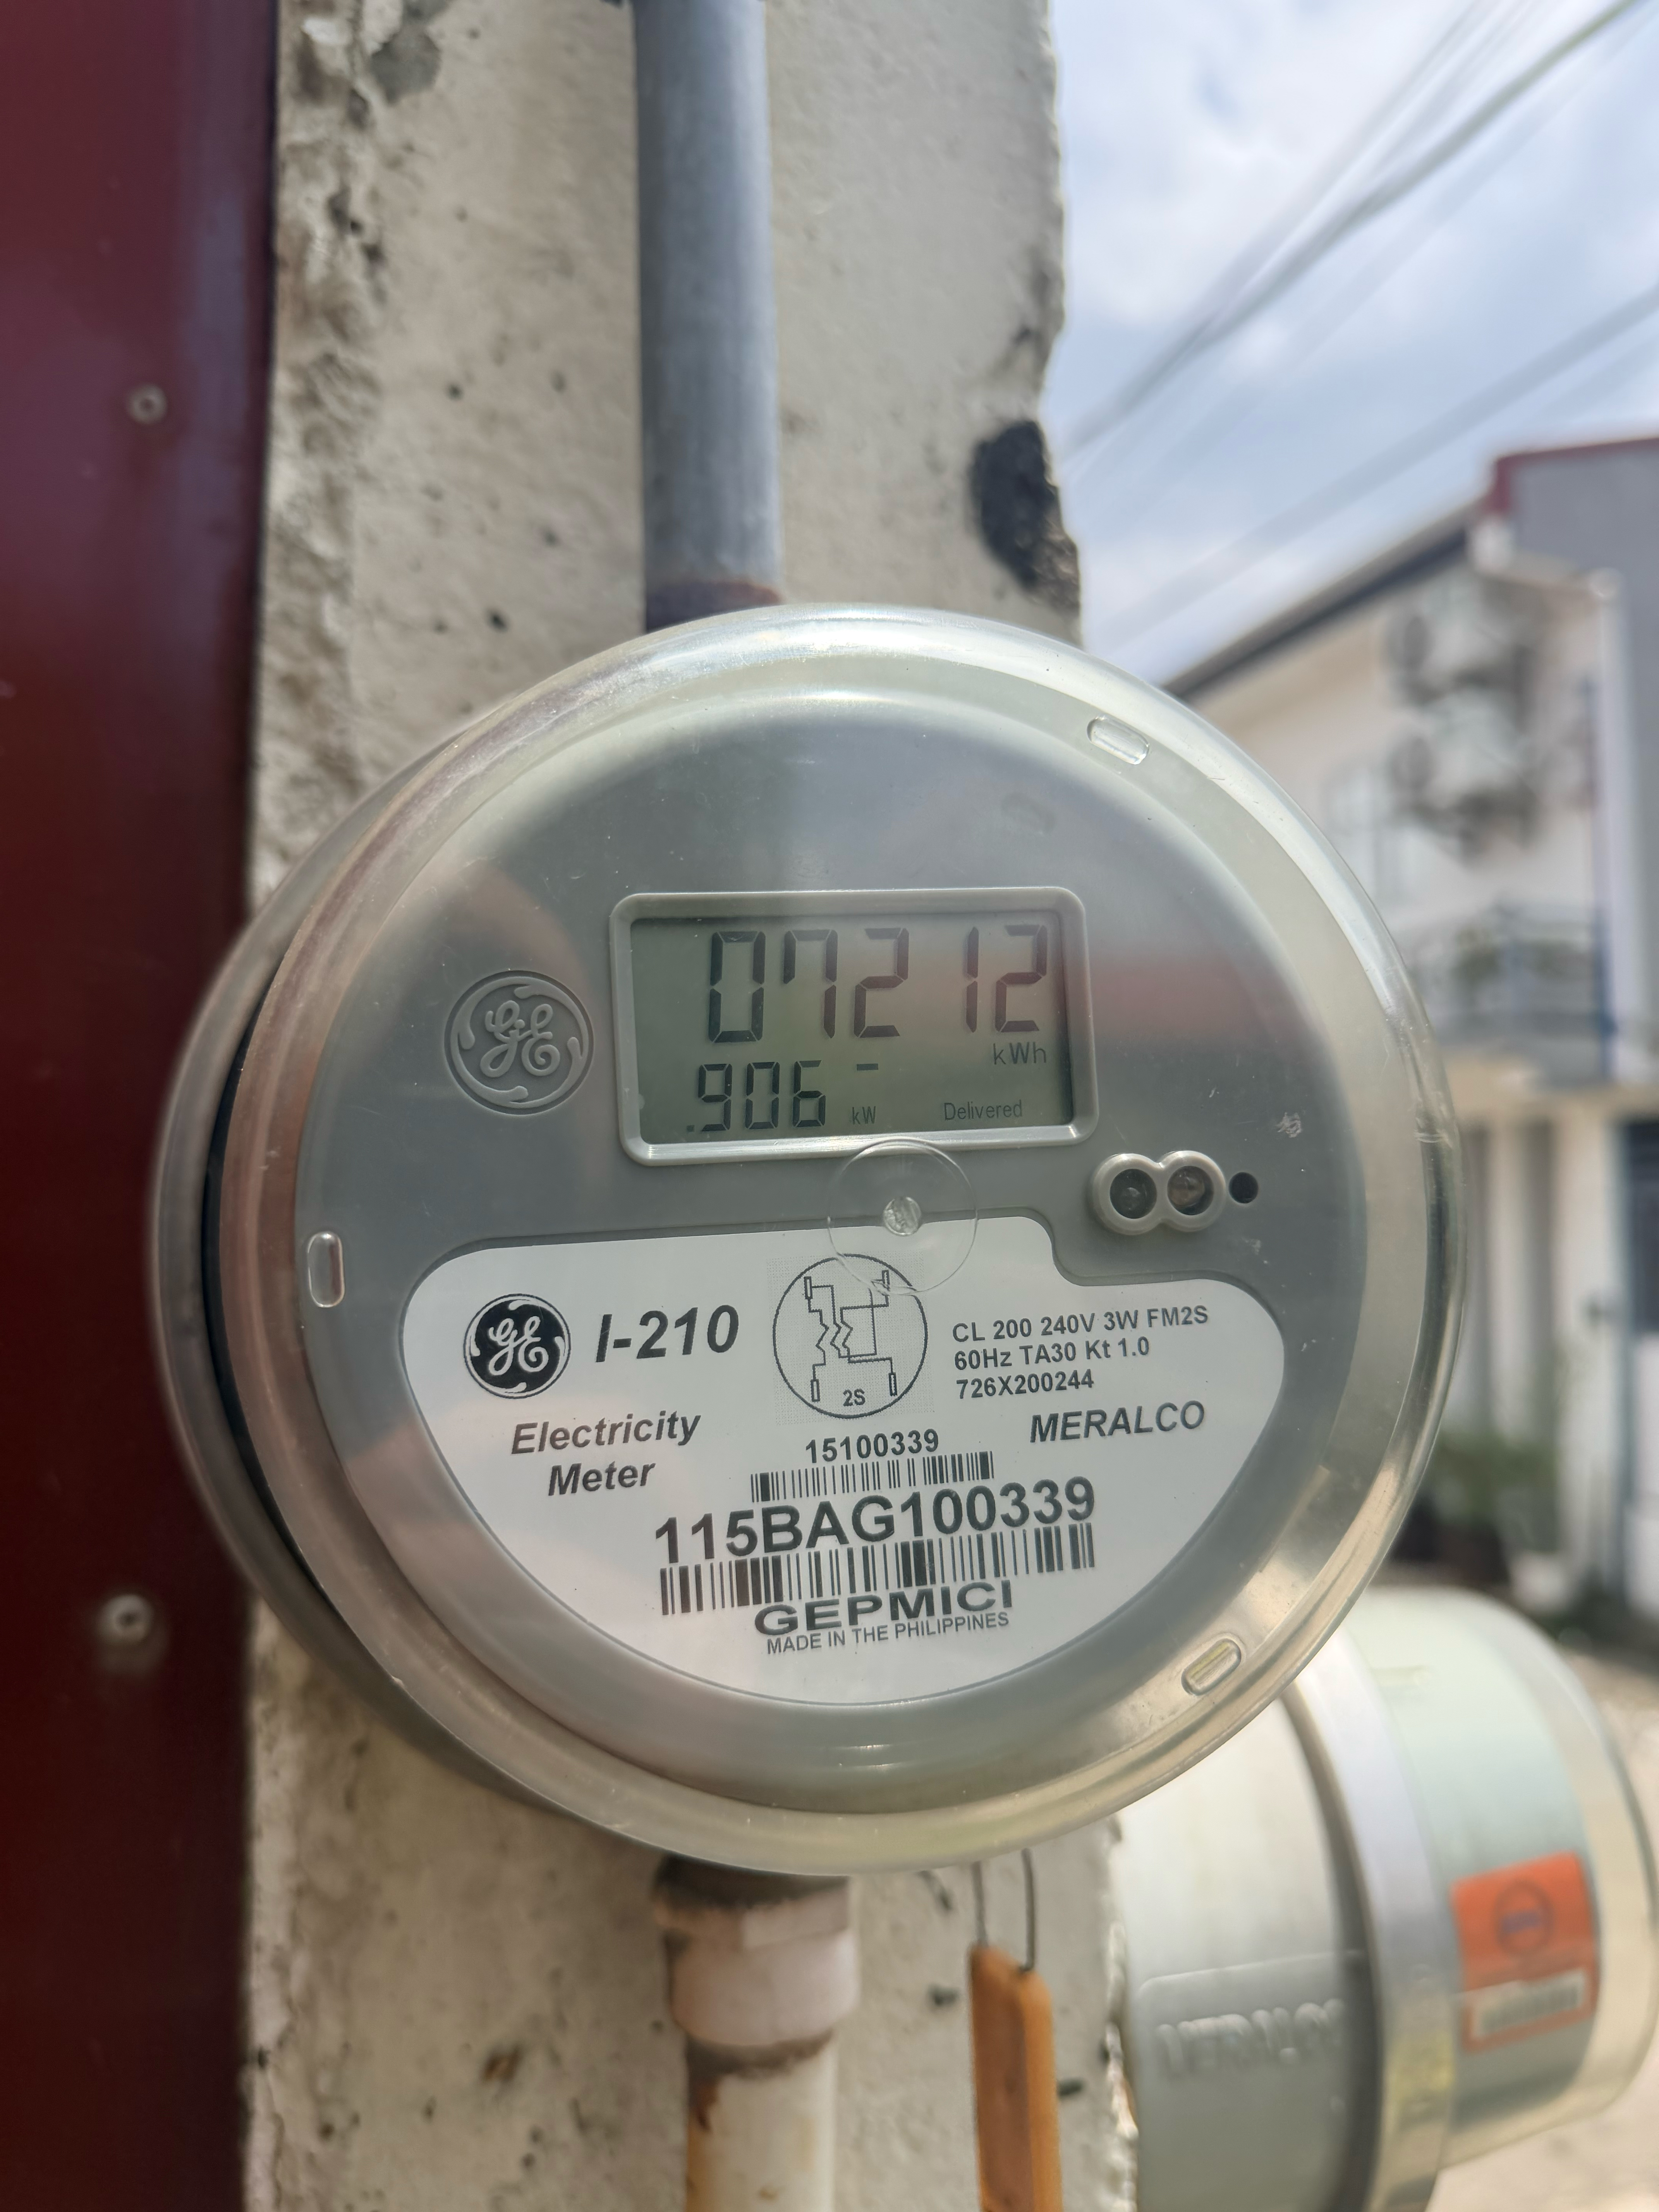
Meralco meter: 906 W
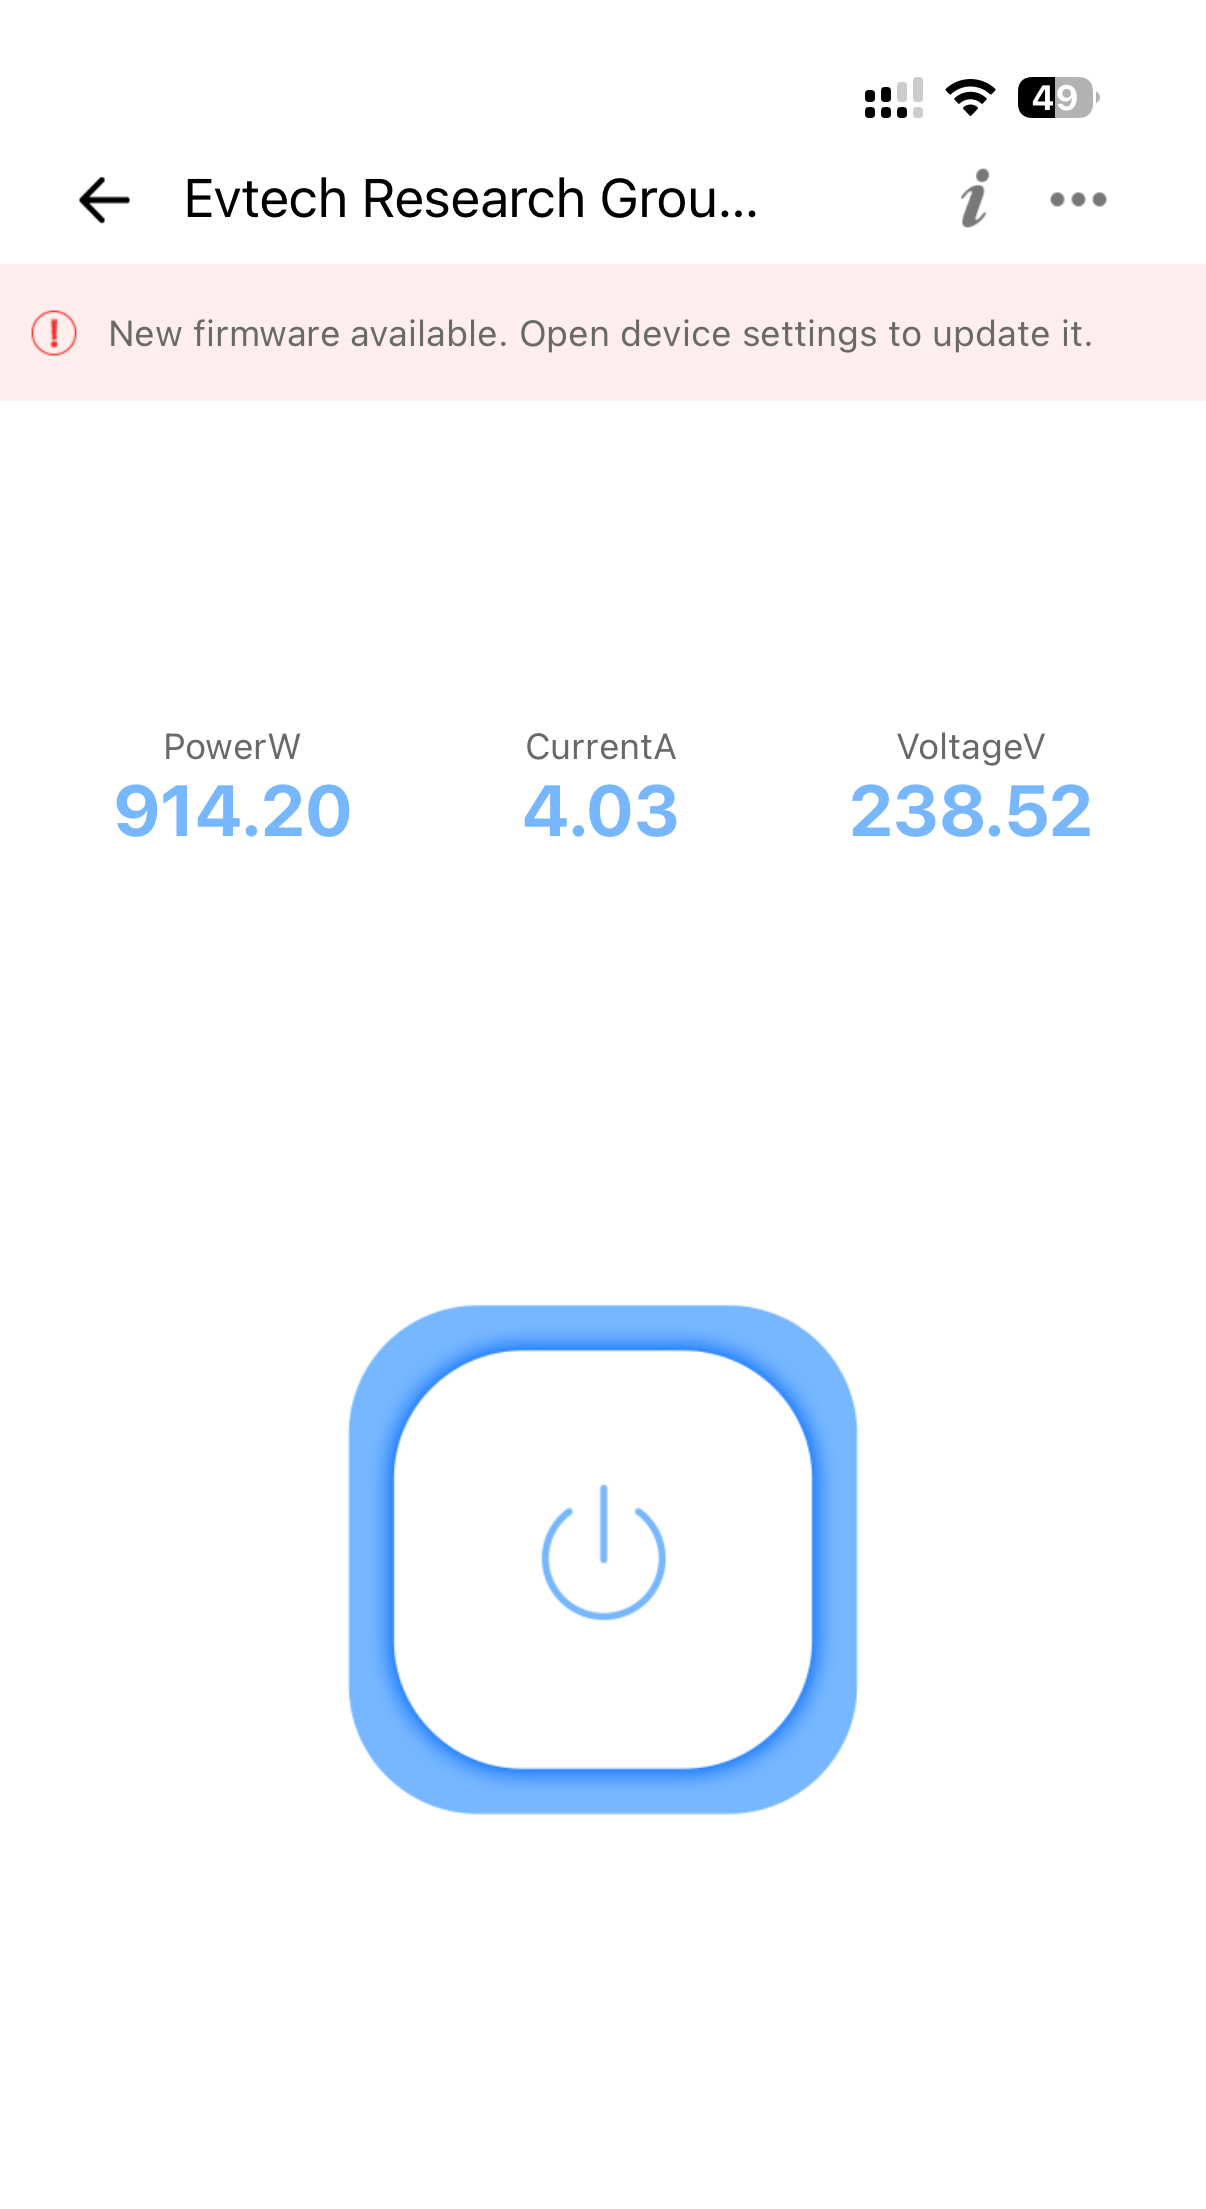
My IoT power meter: 904 W
The difference was only 2 watts, or roughly 0.2%.
For that particular point in time, the readings from two completely independent meters were remarkably close.
That does not mean a single instantaneous measurement is enough to fully validate either meter over an entire billing cycle. A proper long-term comparison would require looking at accumulated energy consumption in kWh over exactly the same start and end dates.
Still, based on the measurements I have taken so far, I have not observed any significant or suspicious discrepancy between Meralco’s meter and my independent monitoring setup.
What turned out to be more interesting, however, was the bill itself.
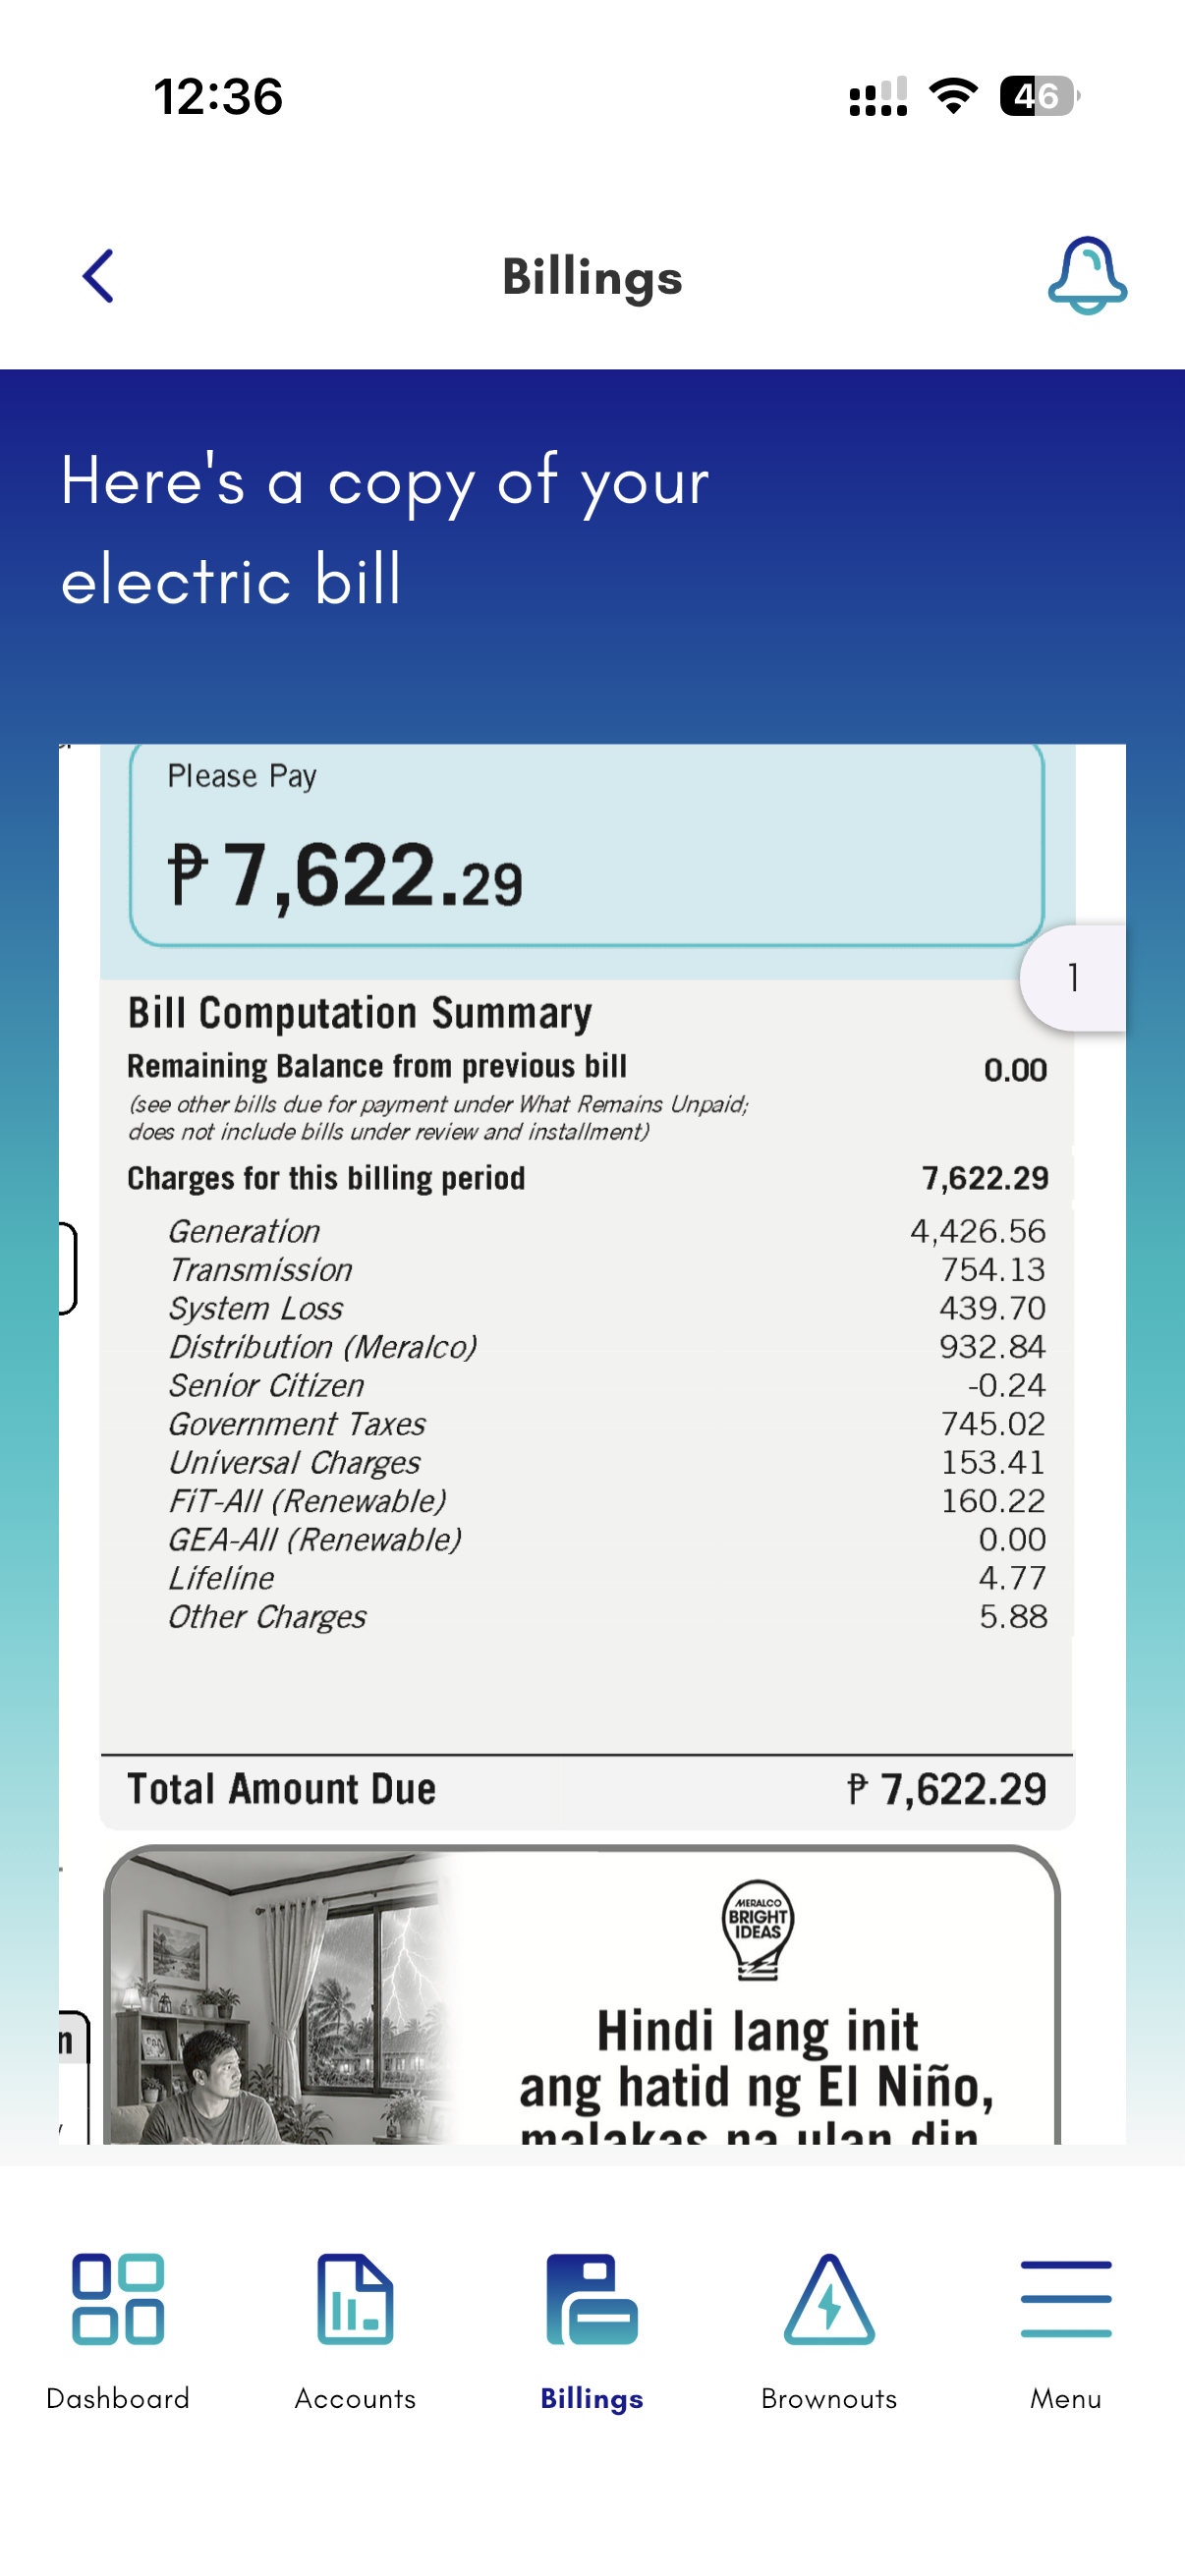
Our total electricity bill for the billing period was ₱7,622.29, while the Generation Charge was ₱4,426.56.
That means the Generation Charge accounted for approximately 58% of the total bill.
The remaining ₱3,195.73, or roughly 42%, came from the other components of the electricity bill, including:
• Distribution — ₱932.84
• Transmission — ₱754.13
• Government Taxes — ₱745.02
• System Loss — ₱439.70
• Universal Charges — ₱153.41
• FiT-All — ₱160.22
• Lifeline and other charges — a smaller remaining portion
This is an important distinction because an electricity bill is not simply:
Energy consumed in kWh × Generation Charge
The final amount also includes charges associated with transmitting and distributing electricity, system losses, taxes, and other regulated components.
One item that may stand out to consumers is the System Loss charge.
Electrical energy is inevitably lost as electricity moves through transmission and distribution infrastructure. A regulated portion of those losses is reflected in the consumer’s electricity bill.
For this billing period, our office consumed 477 kWh and had a total bill of ₱7,622.29.
Using those figures, the effective overall cost of electricity for the billing period was approximately:
₱7,622.29 ÷ 477 kWh = ₱15.98/kWh
This figure represents the total bill divided by the total energy consumed, not just the Generation Charge.
It is also important to remember that electricity rates can change from one billing period to another because several components of the bill vary over time.
This means two months with nearly identical energy consumption can still result in different total amounts due.
For those interested in the technical side, the monitoring architecture is relatively straightforward:
IoT Smart Breaker → Home Assistant → Office Server
The system currently tracks:
• Live Power
• Voltage
• Current
• Energy Consumption
• Estimated Cost
• Billing-Cycle Consumption
Most of the IoT devices in our office are already integrated into the same Home Assistant environment, so power monitoring is part of a larger internal automation and monitoring system.
The estimated cost shown on the dashboard is calculated using the rate configured in my own system. Because electricity rates and billing components can change, I treat this figure as an estimate rather than an exact replacement for Meralco’s billing computation.
The next step is to improve the calibration further and perform a more controlled comparison between the total accumulated kWh recorded by my own meter and the total kWh billed by Meralco over exactly the same billing period.
That would be a much stronger test than comparing instantaneous wattage alone.
For example, if my system records approximately 477 kWh over the same billing period and Meralco also bills 477 kWh, that would provide much better evidence that the two metering systems are closely aligned over time.
This type of monitoring is not limited to laboratories or heavily automated offices.
A similar setup can also be implemented at home using a smart plug, power-monitoring relay, or smart breaker with energy-monitoring capability.
Even basic monitoring can help identify which appliances or circuits consume the most electricity and make it easier to understand where energy is actually being used.
In my case, I originally started this experiment to see whether there was anything unusual about the meter reading.
So far, the meter itself has not been the surprising part.
The breakdown of the electricity bill was.
And as always, keep learning and have fun!
Frequently asked questions
Can you trust Meralco’s electricity meter?
In my test, Meralco’s meter showed 906 W while my independent IoT power monitor showed 904 W at approximately the same moment, a difference of only 2 W or about 0.2%.
Does this test prove that Meralco’s meter is completely accurate?
No. One instantaneous reading cannot validate a meter over an entire billing cycle. A stronger test would compare the accumulated kWh recorded by both systems over exactly the same billing period.
Why did you build your own power monitor?
I wanted an independent way to monitor our office’s electricity consumption, track real-time power and energy usage, and compare those measurements with Meralco’s meter.
Why is the total Meralco bill much higher than the Generation Charge?
The total electricity bill also includes transmission, distribution, system loss, government taxes, Universal Charges, FiT-All, and other regulated billing components.
How much of the bill was the Generation Charge?
Our total bill was ₱7,622.29, while the Generation Charge was ₱4,426.56, or approximately 58% of the total amount.
What was the effective electricity rate during this billing period?
The office consumed 477 kWh with a total bill of ₱7,622.29, giving an effective overall cost of approximately ₱15.98 per kWh.
Can I build a similar electricity-monitoring system at home?
Yes. A smart plug, energy-monitoring relay, or smart breaker can measure electricity usage. More advanced systems can also be integrated with platforms such as Home Assistant.
Photos
Article media.
Google sign-in is optional and stays blocked until you enable it in .
We have a be nice policy. Please be positive and constructive.
No comments yet.